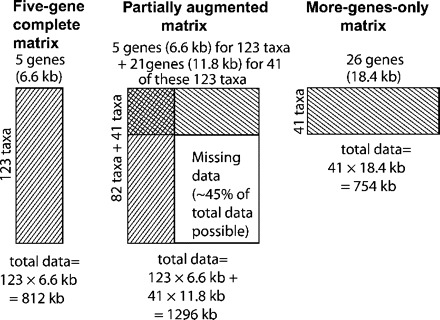
FIGURE 1.

Diagram of gene and taxon sampling design, showing relationships among the three data sets analyzed. a) Five-gene complete matrix (123 taxa; from Regier et al. 2009). b) Partially augmented matrix, deliberately incomplete, created by adding 21 genes for just 41 of the 123 taxa in the five-gene complete matrix. c) More-genes-only matrix, consisting of just the 41 species sequenced for all 26 genes.
