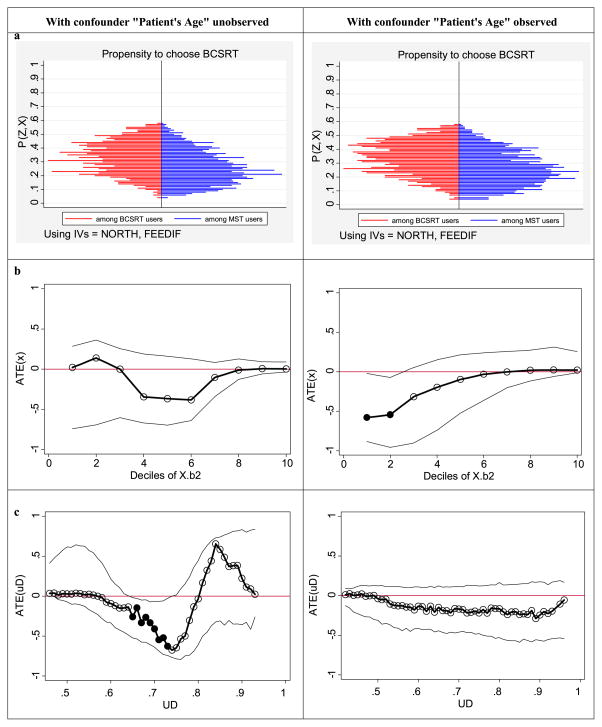
Fig. 1.
(a) Estimated propensity for choosing BCSRT among BCSRT and MST receivers. (b) Heterogeneity in treatment effects across deciles (ηq, q = 1, …, 10) of Xβ2. (c) Heterogeneity in treatment effects across UD, propensity to select BCSRT based on unobserved confounders. (Solid circles in (b) and (c) represent treatment effects that are significant at 5% level)

