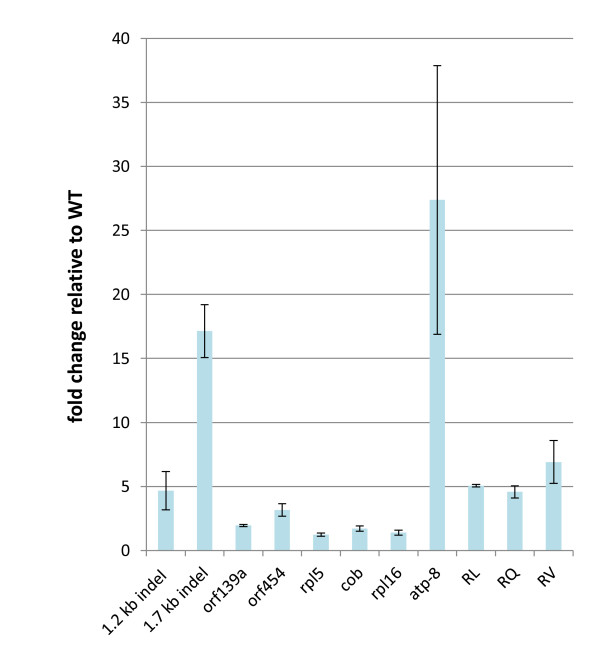
Figure 4.
Graphical presentation of results from quantitative PCR to assess changes in relative copy number of 11 different regions of the mitochondrial genome in wild-type (Col-0) and msh1 mutant lines. Error bars show standard errors for three biological replicates with quantitative PCR results from Col-0 set at 1. "HCN" indicates high copy number version of Atp8.

