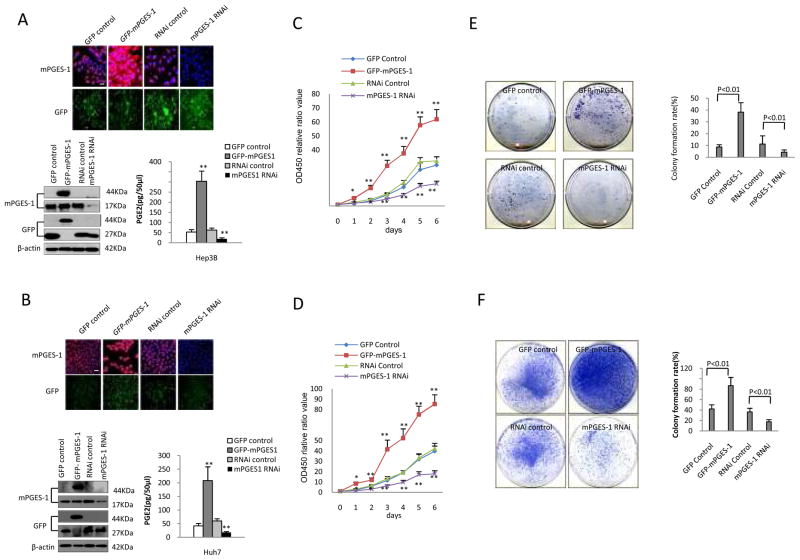
Figure 1. mPGES-1 promotes human HCC cell growth, in vitro.
A & B. Immunofluorescence staining and Western blotting for mPGES-1 in Hep3B (A) and Huh7 (B) cells stably transfected with four different vectors: GFP control (pCMV6-AC-GFP); GFP-mPGES-1 overexpression (pCMV6-AV-GFP-mPGES-1); RNAi control (pGFP-V-RS); and mPGES-1 RNAi (pGFP-V-RS-mPGES-1 RNAi). Upper panels: Immunofluorescence staining of mPGES-1 in four stable cell lines (TRITC staining with DAPI counterstaining) and the corresponding GFP fluorescence (original magnification ×100; scale bars 10μm). Lower Left: Western blotting of mPGES-1 in four stable cell lines. The level of mPGES-1 is increased in mPGES-1 overexpressed cell line (44KD, GFP-mPGES-1 fusion protein) and decreased in mPGES-1 RNAi cell line (17KD). β-actin was used as the loading control. Lower Right: The synthesis of PGE2 in cells stably transfected with the mPGES-1 overexpression vector or RNAi vector. Cell culture supernatants were collected to measure PGE2 level by using the PGE2 enzyme immunoassay system (GE Healthcare). The data are presented as mean ± SEM (** p<0.01 compared to the corresponding vector control cells).
C & D. Cell proliferation assay (WST-1) in HCC cells with altered mPGES-1 expression. Hep3B (C) and Huh7 (D) cells were synchronized in G0 phase by serum deprivation and then released from growth arrest by re-exposure to complete medium containing 10% fetal bovine serum. The cell proliferation and viability were determined by the WST-1 assay in 96-well plates. Each sample was assayed in triplicates for 6 consecutive days. Cell growth curve was determined on the relative values of OD450 and each point represents the mean ± SEM from three independent experiments (* p<0.05; ** p<0.01).
E-F. Colony formation assays in cell culture plates (E - Hep3B; F - Huh7). Representative photographs of colony formation from different stable cell lines are shown at the left panels. The colony formation rate (%) is shown in the right panels (calculated by dividing the colony numbers by 1 × 10³ plated cells). The data (mean ± SEM) were obtained from three independent experiments.

