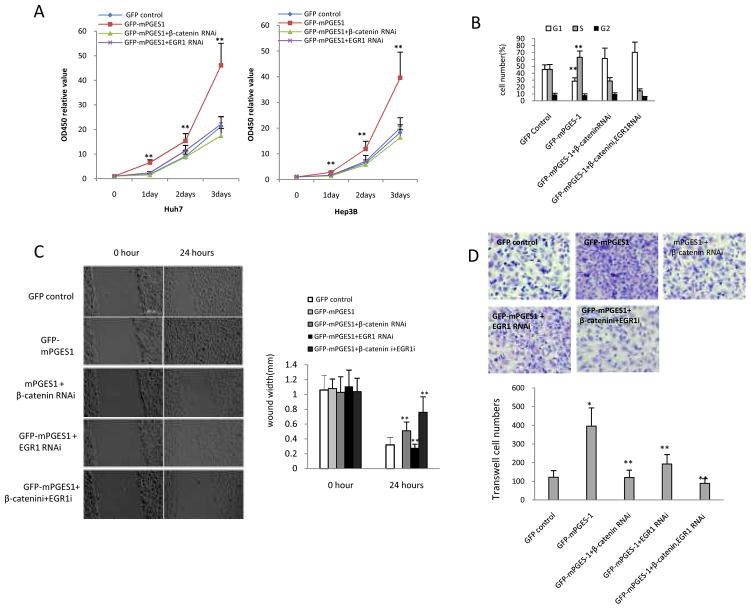
Figure 10. mPGES-1-mediated HCC cell growth and invasion depend on β-catenin and EGR1 status in Huh7 cells.
A. Cell growth assay. Huh7 cells and Hep3B cells stably transfected with the control vector or mPGES-1 expression vector were transfected with the β-catenin siRNA or EGR1 siRNA and the cell growth was determined by WST-1 assay. The data represent the mean ± SEM from three independent experiments (** p<0.01; left panel – Huh7 cells; right panel – Hep3B cells).
B. Cell cycle analysis. Huh7 cells stably transfected with the control vector or mPGES-1 expression vector were transfected with the β-catenin siRNA and/or EGR1 siRNA; cell cycle progression was determined by flow cytometry. The data are expressed as Mean ± SEM (**P<0.01).
C. Wound healing assay. Representative photographs of cell migration/injury repair from different groups are shown at the left panels (0 and 24 hours after scratch, scale bar 500μm). The average wound width is shown at the right panels (** p<0.01 compared to mPGES-1 overexpression alone).
D. Transwell cell invasion assay. Huh7 cells stably transfected with the mPGES-1 expression vector or control vector were transfected with the β-catenin siRNA and/or EGR1 siRNA; cell invasion was determined by transwell assays. Representative photographs of invaded cells from different groups are shown at the upper panel. The average numbers of the invaded cells from different groups are shown at the lower panel (the data are presented as Mean ± SEM) (*p<0.01 compared to control; **p<0.01 compared to mPGES-1 overexpression).

