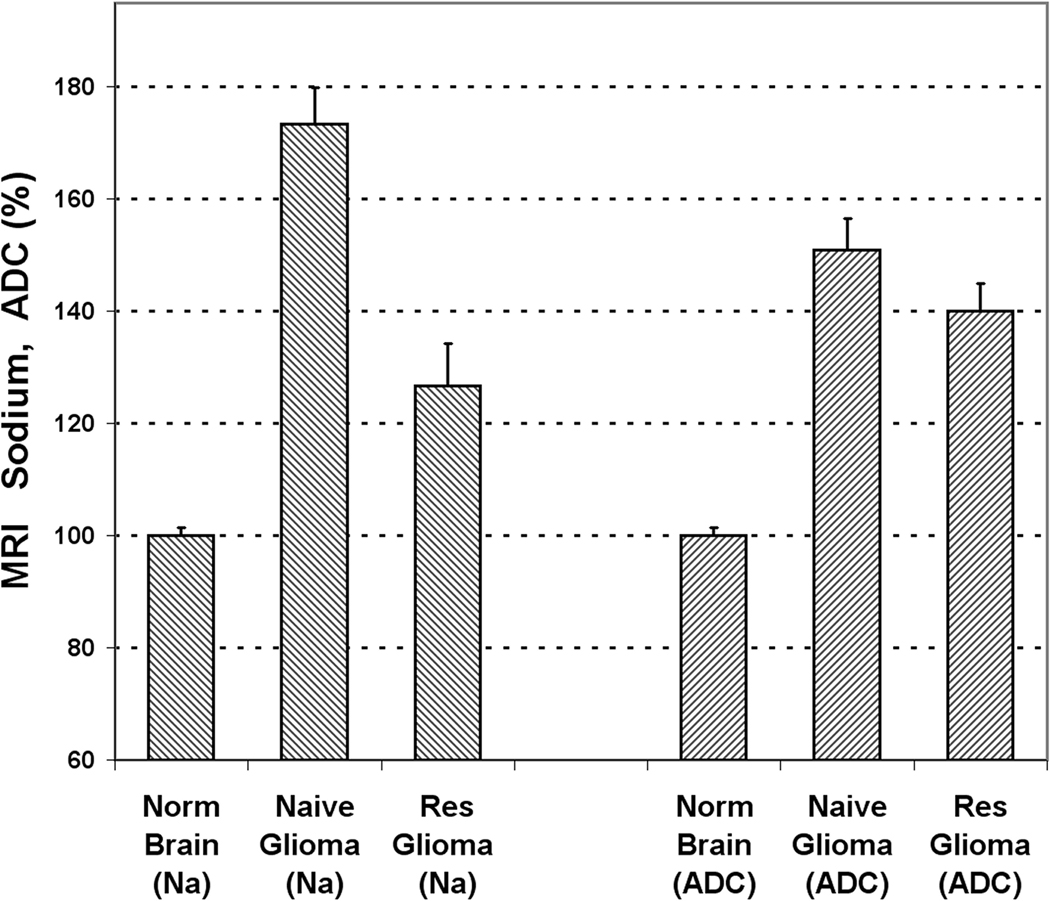
Fig. 3.
In vivo sodium and diffusion MRI of two rat gliomas at 11 days after 9L cell implantation. The values of sodium and diffusion are given in percent relative to the contra-lateral normal brain. Error bars represent standard deviations. The difference between tumors created by naïve and resistant cell lines are statistically significant for both sodium concentration (n = 5, p = 0.0003) and diffusion (n = 5, p = 0.012). It is important to note that sodium MRI is more sensitive to changes in glioma resistance.

