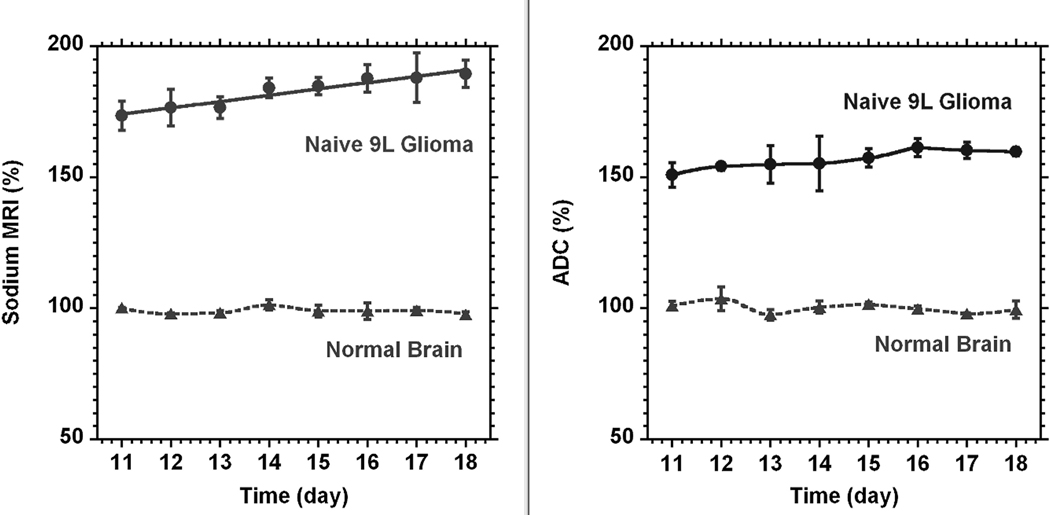
Fig. 4.
The time courses of sodium (left) and diffusion (right) MRI for a naïve type 9L glioma (●, n = 3). The time scale on the figure was given from tumor implantation. Sodium and diffusion MRI data are given in percent relative to normal contra-lateral brain (▲). The data for tumor sodium concentration were fitted by a linear function. The reference (100%) was the average of all sodium or diffusion data through the time course. All data points are presented as mean ± SD. Sodium concentration in the tumor steadily increased with the rate 2.4 ± 0.6% (SD) per day. Diffusion was practically unchanged (1.4 ± 0.5% (SD) per day). Sodium values were corrected for partial volume effect. Curves for normal brain and diffusion in glioma were created by smooth function.

