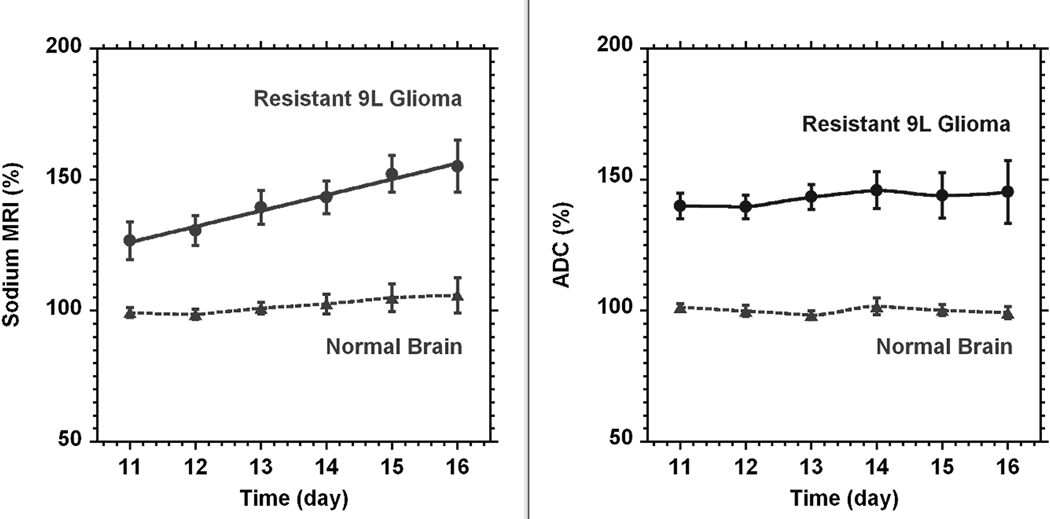
Fig. 5.
The time courses of sodium concentration (left) and diffusion (right) in rat glioma (●, n = 5) created from the resistant 9L cell line. The time scale on the figure was given from tumor implantation. Sodium and diffusion in the tumor are presented as percent relative to the normal contra-lateral part of the brain (▲). The reference (100%) was the average of all sodium or diffusion data through the time course. All points are given as mean ± SD. Linear fit of sodium and diffusion data for the tumor gave a sodium increase in time at a rate of 5.8 ± 0.8% (SD) per day and almost no change in diffusion (1.2 ± 0.8% (SD) per day). Curves for normal brain and diffusion in glioma were created by smooth function.

