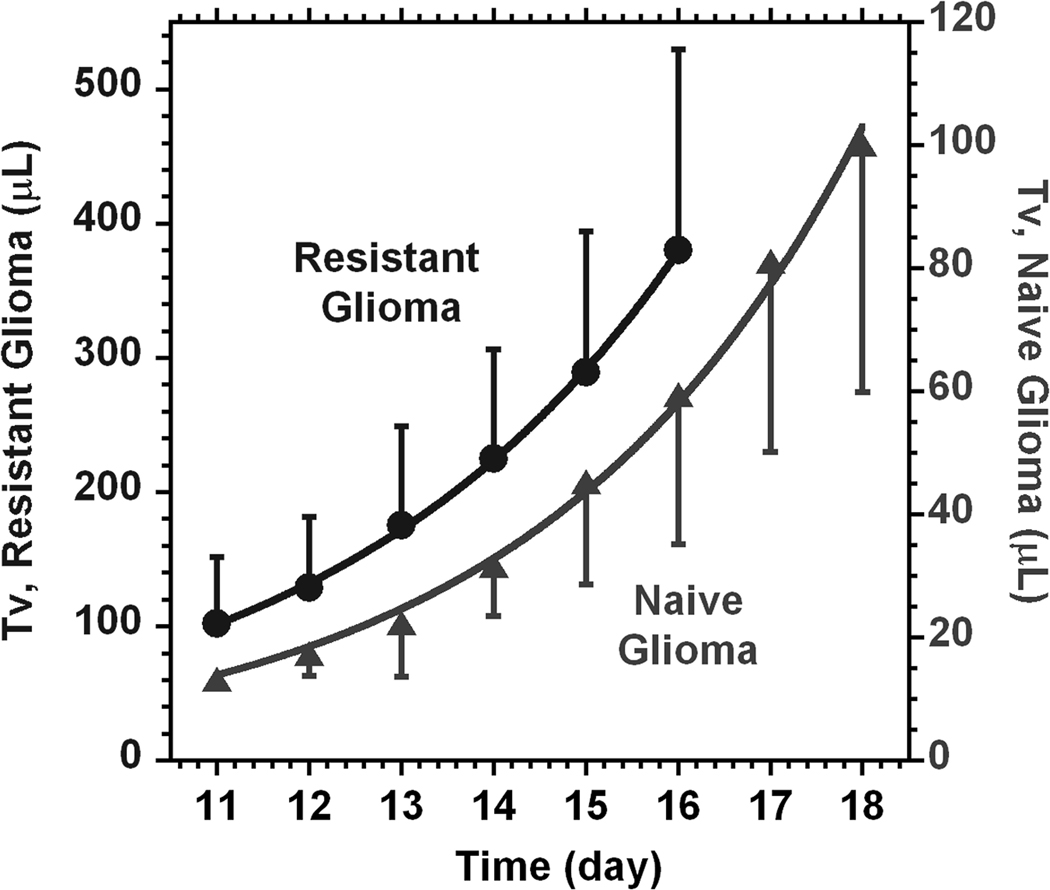
Fig. 6.
The time courses of tumor volume changes from day 11 after surgery for naïve (▲) and resistant (●) 9L cell lines. Curve lines represent the results of fitting to a model function (Tv = a1*(2)time/a2). From the fit, the tumor doubling time a2 for naïve cells is 2.6 ± 0.1 (SD) days and the corresponding doubling time for the resistant cell line is 2.4 ± 0.2 (SD) days.

