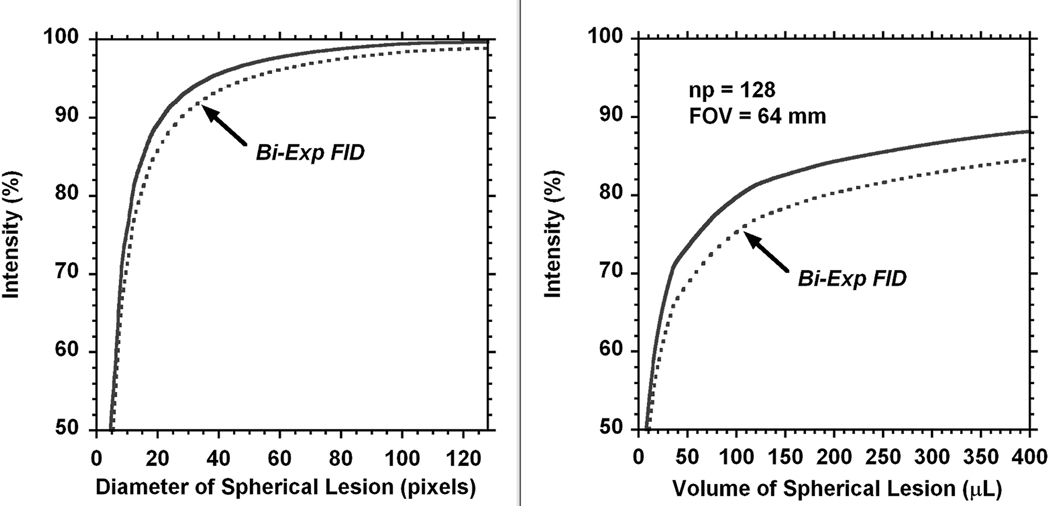
Fig. 7.
3D model of the partial volume effect in MRI. Lesion had spherical size with a diameter presented by pixel number (x-axis). The average intensity of each voxel (y-axis) in the lesion is given relative to the lesion reference with the size of FOV and covered by matrix of 128×128×128 (left part). The right side represents the PV effect for the range of tumor volumes detected in the present experiments. Both parts of the figure represent PV effect for the MRI intensity of lesion relative to the surrounding area. The dotted lines present a possible additional contribution which may occur due to the bi-exponential decay of the FID. The shape of the bi-exponential function is described in the text.

