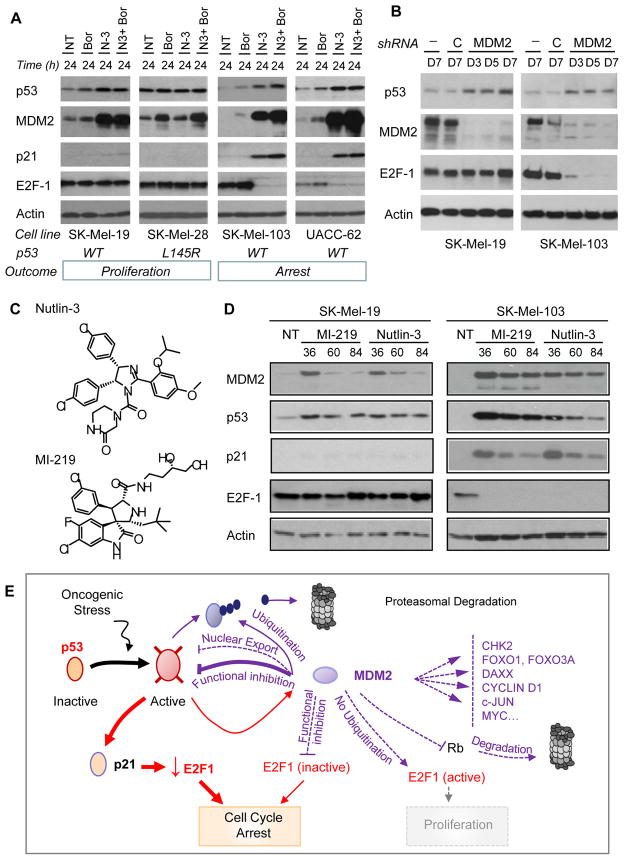
Figure 7. E2F1 marks the sensitivity of melanoma cells to MDM2 inactivation.
A–B, Expression of the indicated proteins following treatment with the proteasome inhibitor Bortezomib (Brtz, 10 nM), Nutlin-3 (N-3, 5 μmol/L) or the combination of both (N-3+Brtz) at 24 h (A), or following genetic inactivation of MDM2 by RNAi as a function of time (B). C, Molecular structure of small molecule inhibitors Nutlin-3 and MI-219 binding in the MDM2-p53 pocket. D, Depletion of E2F1 upon treatment of sensitive (SK-Mel-103) and resistant (SK-Mel-19) cells by Nutlin-3 (5 μmol/L) or MI-219 (5 μmol/L). E, Summary of described interactions between p53, MDM2, p21 and E2F1 (Polager and Ginsberg, 2009). The specific relationships found by this study in melanoma cells are indicated with thick and continuous lines.

