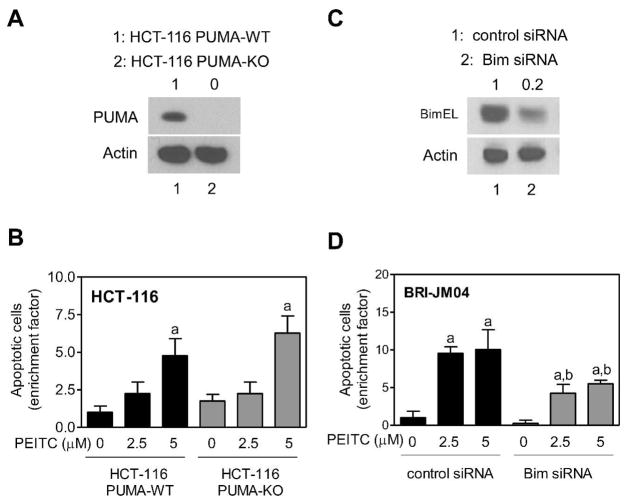
Figure 5.
The PEITC-induced apoptosis in BRI-JM04 cells was regulated by Bim. (A) Western blotting for PUMA using lysates from wild-type HCT-116 cells (HCT-116-PUMA-WT; lane 1) or its isogenic variant lacking PUMA (HCT-116-PUMA-KO; lane 2). Number above band represents PUMA protein level relative to HCT-116-PUMA WT cells. (B) Quantitation of apoptotic cells (DAPI assay) in HCT-116-PUMA-WT and HCT-116-PUMA-KO cultures after 24-hour treatment with DMSO (control) or the indicated concentrations of PEITC. Results are expressed as enrichment factor relative to DMSO-treated control HCT-116-PUMA-WT cells. Experiment was repeated twice in triplicate and representative data from one experiment are shown as mean ± SD (n = 3). aSignificantly different (P<0.05) compared with corresponding DMSO-treated control by one-way ANOVA followed by Bonferroni’s test. (C) Western blotting for BimEL using lysates from BRI-JM04 cells transiently transfected with a control siRNA (lane 1) or a Bim-targeted siRNA (lane 2). Number above band represents BimEL protein level relative to BRI-JM04 cells transfected with control siRNA. (D) Quantitation of apoptotic cells (DAPI assay) in BRI-JM04 cells transiently transfected with a control siRNA or a Bim-targeted siRNA and treated for 48 hours with DMSO or the indicated concentrations of PEITC. Results are expressed as enrichment factor relative to DMSO-treated control siRNA transfected BRI-JM04 cells. Experiment was repeated twice in triplicate and representative data from one experiment are shown as mean ± SD (n = 3). Significantly different (P<0.05) compared with acorresponding DMSO-treated control, and bbetween PEITC-treated groups by one-way ANOVA followed by Bonferroni’s test.

