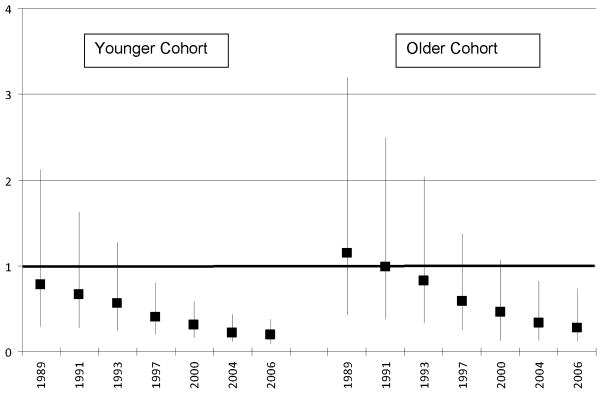
Figure 2. Predicted Odds Ratios for Overweight (BMI≥25) for Highest Education Group Compared Lower Education Group (1989–2006) for Women.
*Figures displays predicted Odds Ratio over survey period based on coefficients from random-effects logistic model in Table 4.

