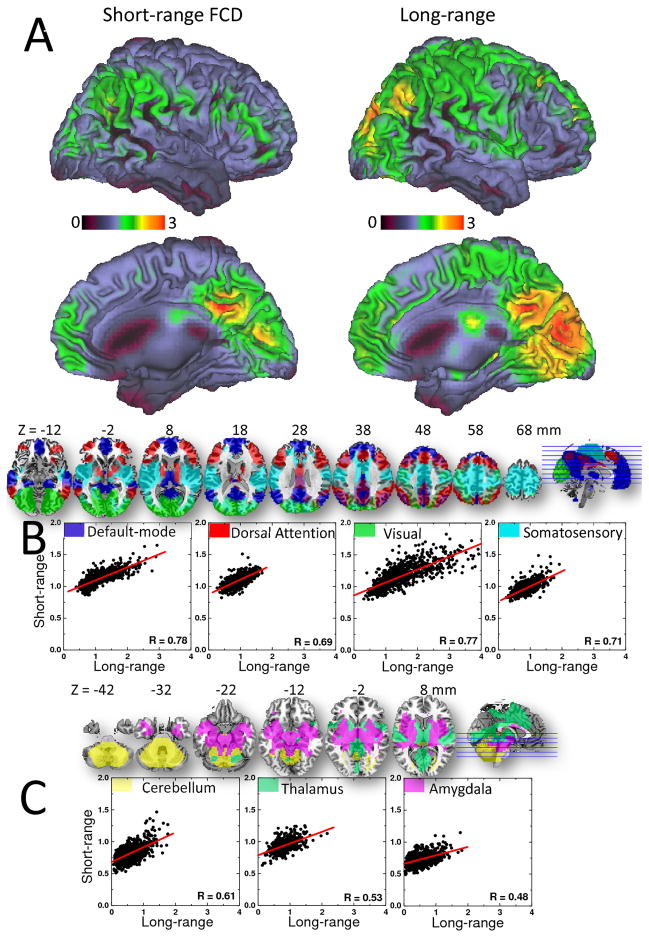
Fig 1.
Fig 1A: Surface rendering showing the distribution of short- and long-range FCD hubs in the human brain. Color maps reflect the average number of functional connections to neighbor (short-range) or remote (long-range) voxels across 913 healthy subjects. Threshold used to compute short- and long-range FCD: R > 0.6. The images were created using the Computerized Anatomical Reconstruction and Editing Toolkit (CARET) 5.0 (http://brainvis.wustl.edu/wiki/index.php/Caret:About). B: Scatter plots depicting the linear association between short- and long-range FCD in four cortical networks (axial views). C: Scatter plots depicting the linear association between short- and long-range FCD in three subcortical networks (axial views).

