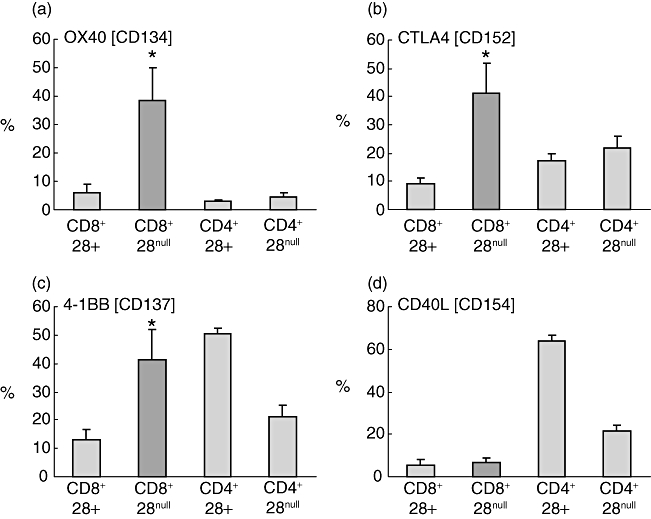
Fig. 4.

Histograms showing production of (a) OX40, (b) cytotoxic T lymphocyte antigen 4 (CTLA4), (c) 4-1BB and (d) CD40L by CD8/CD28null T cells (dark shading) following stimulation of peripheral blood with PMA (n = 5 separate experiments; five never smoker control subjects). Note increased production of OX40, CTLA4 and 4-1BB by CD8/CD28null T cells in contrast to increased expression of CD40L by CD4+CD28+ T cells. Histograms present mean ± standard error of the mean. *Significant (P < 0·05 increase versus CD8+CD28+ T cells).
