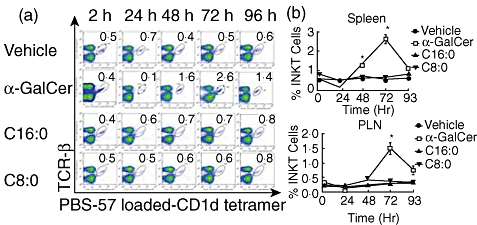
Fig. 3.

In vivo expansion of invariant natural killer T (iNK T) cells. Female non-obese diabetic (NOD) mice (n = 5, 4–6-week-old) were injected with glycolipid (4 µg) or vehicle intraperitoneally and killed 2, 24, 48, 72 or 96 h later. Spleens and pancreatic lymph nodes (PLN) were removed, placed into single cell suspension, counted, stained for iNK T cells using T cell receptor (TCR)-β and phosphate-buffered saline (PBS)-57-loaded CD1d tetramers and analysed by flow cytometry. (a) Fluorescence activated cell sorter (FACS) plots of splenic iNK T cells (gated) assayed from one mouse per treatment at each time-point after injection. After gating on live cells, iNK T cells were gated as PBS-57-loaded CD1d tetramer-positive and TCR-β-positive cells. The numbers in the right-hand corner of each FACS plot indicate the percentages of iNK T cells. (b) Cumulative data from FACS analyses of splenocytes and lymphocytes at each time-point post-injection. Data from one of two independent and reproducible experiments are presented as mean ± standard error of the mean. Asterisks (*) indicate significant significance (P ≤ 0·05) relative to control values.
