
Figure 2.
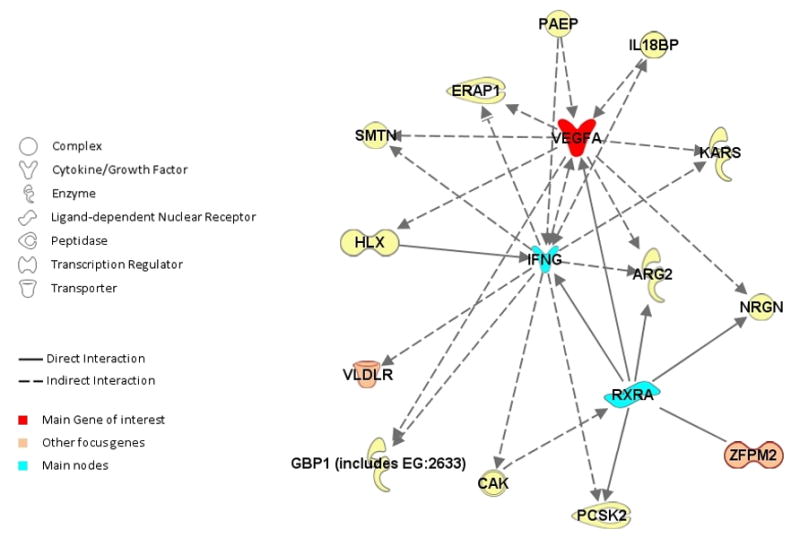
Putative Gene Network based on Ingenuity Path Analysis. Edges are displayed with labels describing the nature of the relationship between the nodes. The lines between genes represent known interactions and the nodes are displayed using various shapes which represent the functional class of the gene product (legend).