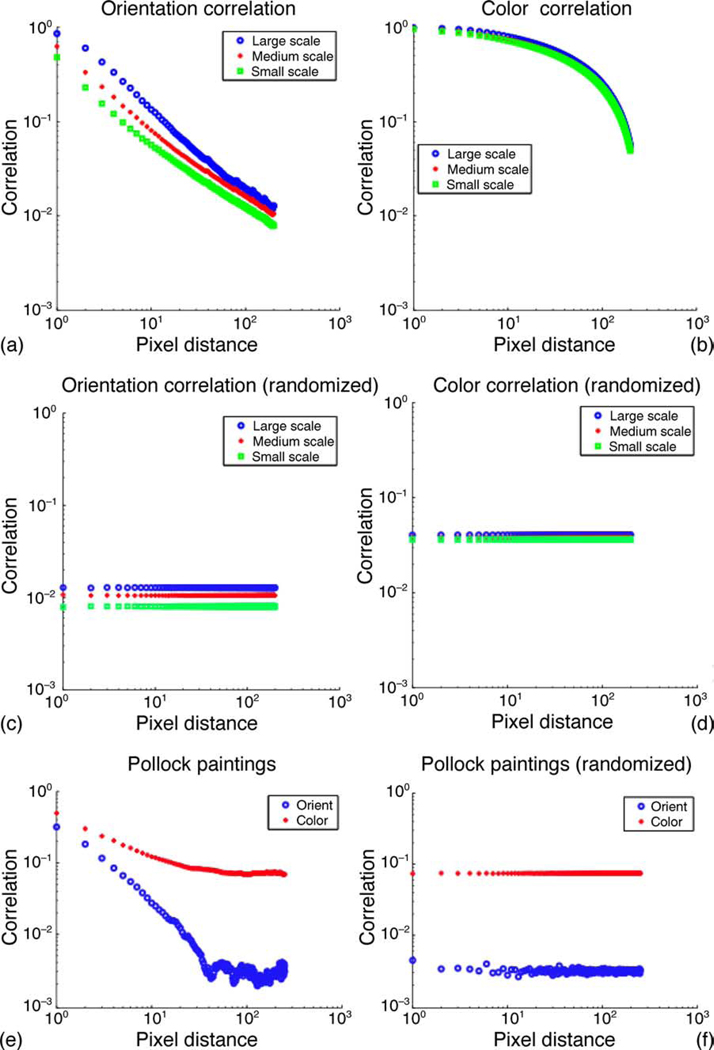
Figure 2.
(a) Spatial autocorrelation of the orientation field in natural images. The orientation is computed at three different spatial scales, ranging from large to small scale. The standard error for the measurements shown is too small to be meaningfully depicted in this figure. For instance, the standard error for the orientation correlation at small scale is 0.0028796 for a pixel distance of 1 and 0.00037322 for a pixel distance of 100. (b) Spatial autocorrelation of the color field in natural images. The color is computed at three different spatial scales, ranging from large to small scale. The original images were smoothed with a Gaussian filter of varying size, as described in Figure 1. The standard error is 0.0022356 for a pixel distance of 1 and 0.0039698 for a pixel distance of 100. (c) The spatial correlation statistics of orientation when the location of orientation vectors is randomized. (d) The spatial correlation statistics of color when the location of color vectors is randomized. In all these plots, the correlations for a given distance have been averaged over all directions. (e) The correlation statistics gathered over five Jackson Pollock paintings. (f) The correlation statistics computed over randomized versions of Jackson Pollock paintings. The locations of existing orientation and color vectors were randomized.

