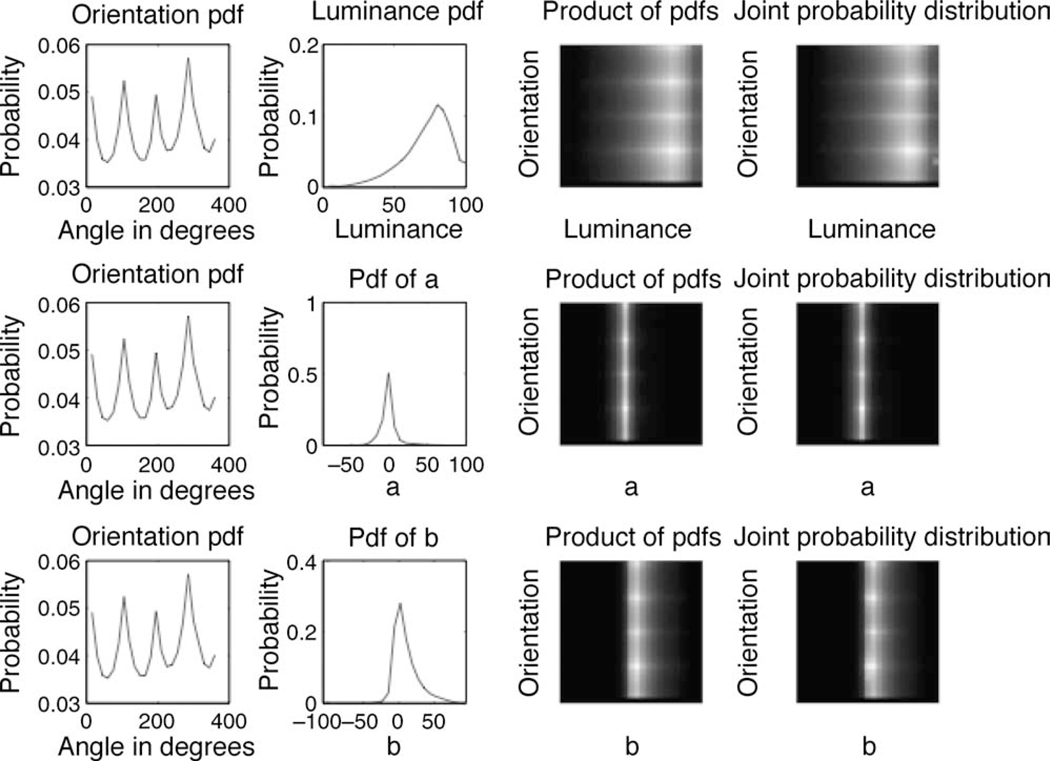
Figure 5.
The marginal probability density functions are displayed in the first two columns. The probability density function for orientation P(θe) is shown in the first column. The second column contains probability density functions for L, a, and b. The third column shows the pairwise product of the two marginal probability density functions in the first two columns. The fourth column shows the joint probability distribution for the variables in the first two columns. These plots show that the joint probability distributions appear similar to the marginal probability density functions, suggestive of statistical independence of the variables represented in the first two columns.

