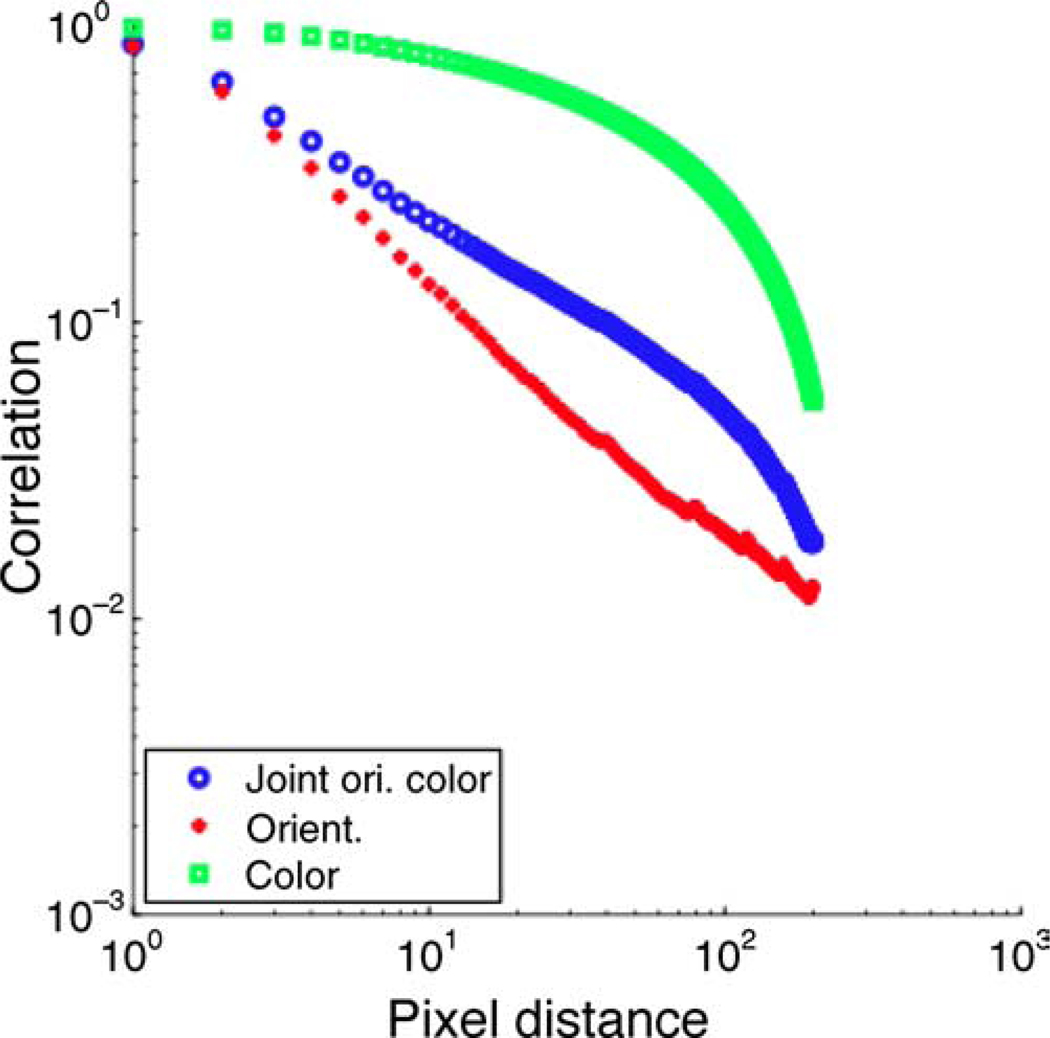
Figure 7.
The 2D correlation statistics of the joint orientation and color vector as described in Equation 5 are compared with the statistics of the individual color and orientation fields. A 1D plot for each case is generated by summing the correlations within an annulus at a given radius of the 2D correlation function.

