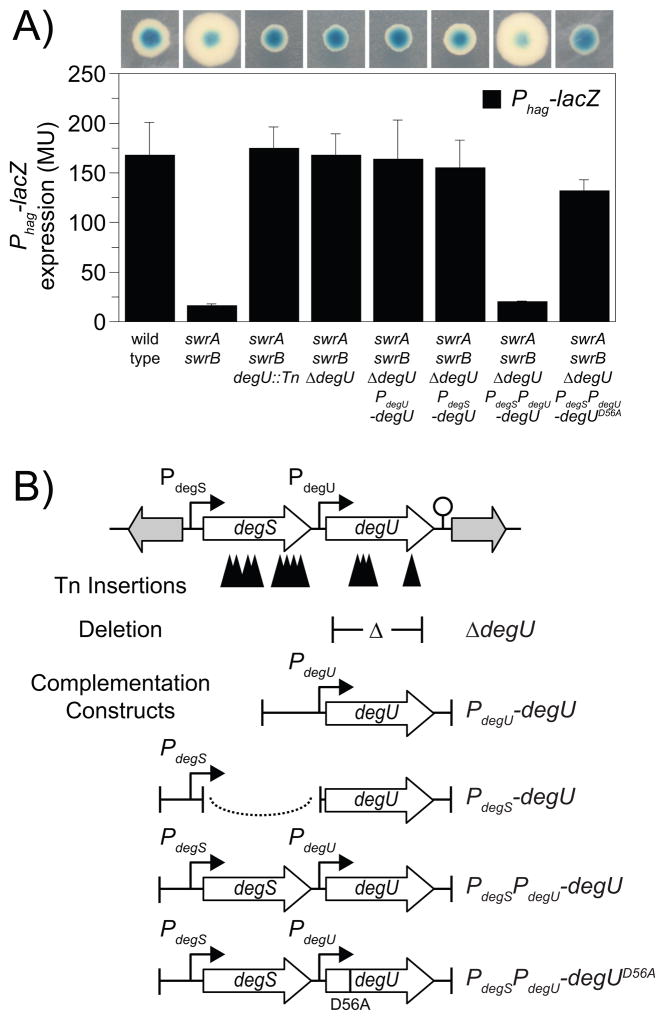
Figure 1. Mutations in degU increase expression from the Phag promoter in a swrA swrB double mutant background.
A) Phag-lacZ activity expressed either as blue/white colony color on media containing X-gal (top) or in Miller units (bottom). The indicated genotypes on the X-axis correspond both to the bars and to the colonies directly above. The following strains were used to generate this figure: wild type (DS793), swrA swrB (DS3789), swrA swrB degU::Tn (DS3442), swrA swrB ΔdegU (DS3794), swrA swrB ΔdegU (PdegU-degU) (DS5643), swrA swrB ΔdegU (PdegS-degU) (DS5502), swrA swrB ΔdegU (PdegSPdegU-degU) (DS5503), and swrA swrB ΔdegU (PdegSPdegU-degUD56A) (DS6563). Each bar is the average of 6 replicas and error bars are standard deviations. Raw data is found in Table S1. The basis for the increased colony size of swrA swrB mutants is unknown and was not studied here. B) Genetic map of the degS-degU operon. Open arrows represent open reading frames. Bent arrows represent promoters. Lollipop represents putative rho-independent terminator. Solid triangles represent the sites of transposon insertions that restored blue colony color to a swrA swrB Phag-lacZ genetic construct on media containing X-gal. Δ symbol within T-bars represent the boundaries of an in-frame markerless deletion mutation in degU. Dotted line represents the fusion of two genetic fragments.

