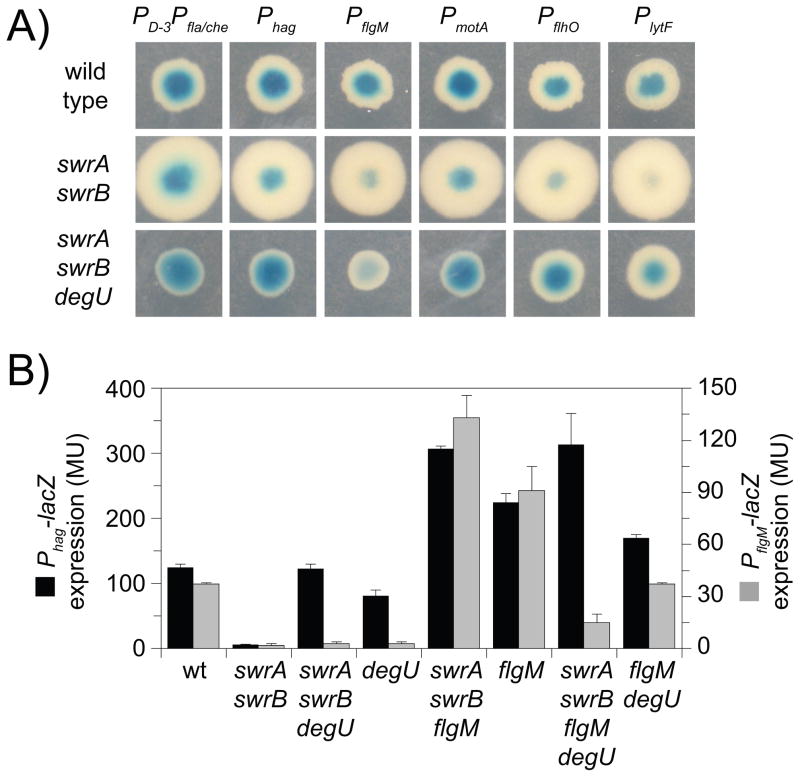
Figure 3. DegU activates expression of PflgM.
A) A grid of colonies of the genotype indicated vertically containing the promoters indicated horizontally fused to lacZ and grown on media containing X-Gal. Strains containing the following reporters were used to generate this panel: PD-3Pfla/che (DS791, DS3790, DS3795); Phag (DS793, DS3789, DS3794); PflgM (DS811, DS3792, DS3797); PmotA (DS1849, DS3793, DS3798); PflhO (DS5776, DS5778, DS5780); and PlytF (DS5775, DS5777, DS5779). B) Expression of Phag-lacZ (black bars) and PflgM-lacZ (gray bars) expressed as Miller units. The following strains were used to generate this figure: wild type (DS793, DS811), swrA swrB (DS3789, DS3792), swrA swrB degU (DS3794, DS3797), degU (DS4654, DS3658), swrA swrB flgM (DS6385, DS6386), flgM (DS4752, DS4754), and swrA swrB flgM degU (DS6408, DS6409). Columns are the average of six replicas and error bars are standard deviations. Raw data is found in Table S2.

