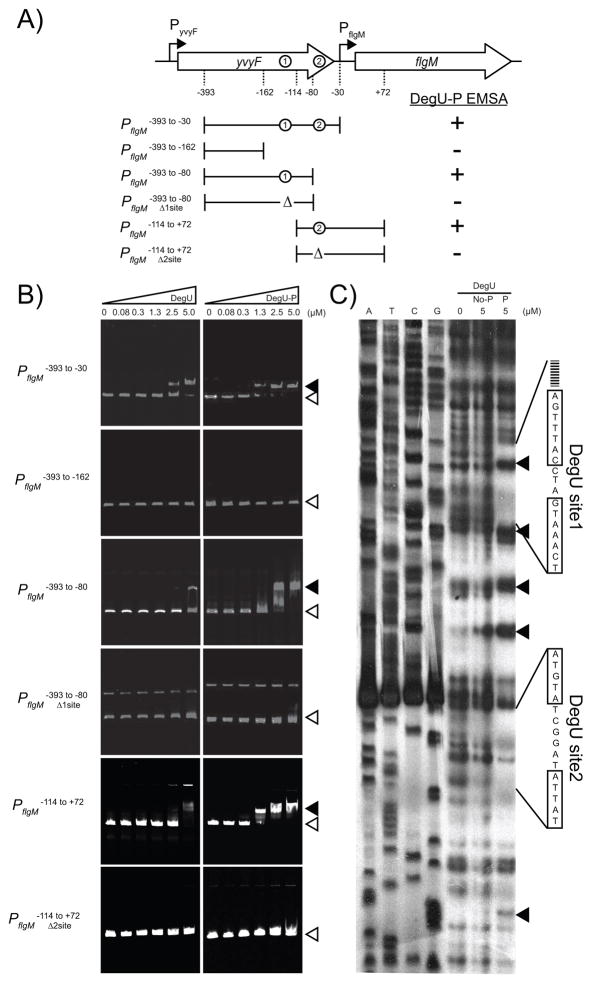
Figure 5. DegU-P binds to the promoter region of PflgM.
A) A map of the PflgM promoter region. Large open arrows indicate open reading frames. Bent arrows indicate promoters. Dashed lines indicate important positions with respect to the EMSA experiments in panel B. Circles indicate the positions of DegUsite1 and DegUsite2. Brackets indicate the boundaries of the fragments used in the EMSA experiments in panel B. Δ indicates deletion of a DegU binding site. Results of the EMSA experiments in panel B are summarized as either + (indicating a the presence of a mobility shift) or − (indicating the absence of a mobility shift. B) Electrophoretic mobility shift experiments. The target DNA fragments are indicated vertically. The left hand series of panels includes an increasing concentration of DegU protein. The right hand series of panels includes an increasing concentration of DegU-P protein that was phosphorylated by DegS and ATP. Concentrations of DegU are listed across the top in μM. Open triangles indicate the position of of the unbound fragment; closed triangles indicate the position of the shifted fragment. C) DNase footprint protection experiment of PflgM promoter region. Left hand lanes are DNA sequencing lanes of the indicated base. Right hand lanes include increasing amounts of either 0 μM DegU, 5 μM DegU (No-P), or 5 μM DegU-P (P) phosphorylated by incubation with ATP and DegS. Lines indicate the boundaries of protection and the boxes indicate the sequences of the protected inverted repeats. Closed triangles indicate sites that became hypersensitive to DNase digestion. Corresponding regions of protection from DNase digestion were detected on the other DNA strand (data not shown).

