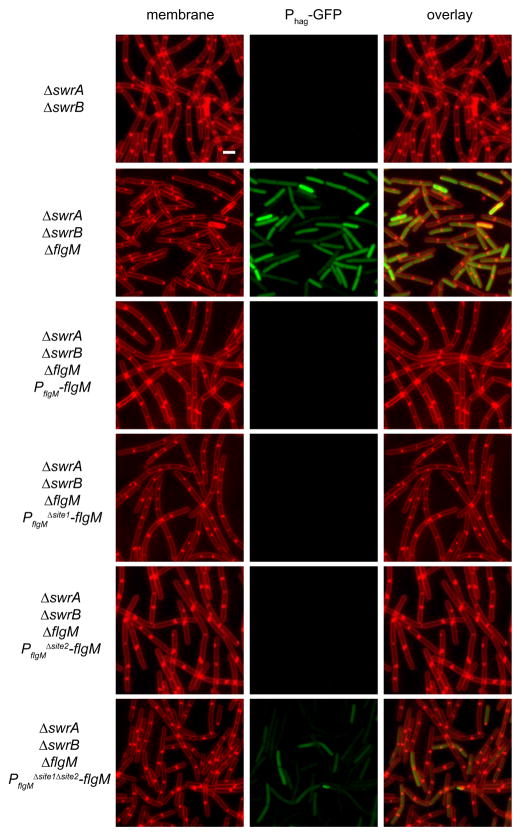
Figure 6. Either of the DegU binding sites upstream of PflgM are sufficient to activate flgM expression.
Fluorescent micrographs of cells expressing Phag-GFP in backgrounds of the indicated genotype. Membranes were false-colored red. GFP reporter expression was false-colored green. The following strains were used to generate this figure: swrA swrB (DS8014), swrA swrB ΔflgM (DS7740), swrA swrB ΔflgM PflgM-flgM (DS7762), swrA swrB ΔflgM PflgMΔsite1-flgM (DS7763), swrA swrB ΔflgM PflgMΔsite2-flgM (DS8430), and swrA swrB ΔflgM PflgMΔsite1Δsite2-flgM (DS8662). Scale bar is 2 um.

