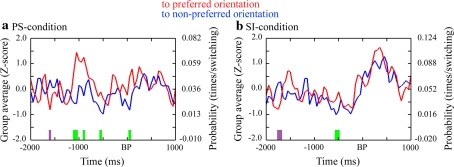
Fig. 2.
Comparison of blink probabilities between perceptual switching to preferred and non-preferred orientations in the PS-condition (a) and those between stimulus change to preferred and non-preferred orientations in the SI-condition (b). Temporal frequency distributions of blink probabilities in individual participants were Z-transformed and subsequently averaged across participants. The color red denotes blink probabilities for perceptual switching or stimulus change to the preferred orientation. Blue denotes blink probabilities for perceptual switching or stimulus changes to the non-preferred orientation. Green denotes periods in which perceptual switching or stimulus change to the preferred orientation showed larger blink probabilities (P < 0.005). Purple denotes periods in which perceptual switching or stimulus change to non-preferred orientation showed larger blink probabilities (P < 0.005)

