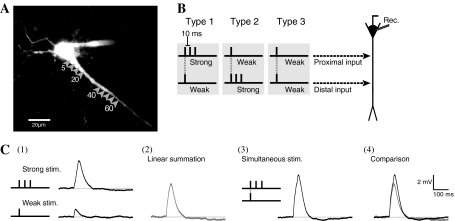
Fig. 1.
Experimental protocols. a Image of hippocampal CA1 neuron visualized with Ca2+ sensitive dye (OGB-1). Arrow heads indicate stimulations sites and the numbers below the arrow heads indicate the distance from the soma (μm). b Three types of electrical stimulation set. Two stimulation sets consist of a pair of strong (three pulses at 10-ms intervals) and weak (one pulse) stimulation: in Type 1 there is strong input to the proximal site and weak input to the distal site; in Type 2 there is strong input to the distal site and weak input to the proximal site; Type 3 consists of weak inputs to both sites. c Comparison between the traces from paired stimuli and sum of the traces of the two individual stimulations. Each trace indicates (1) responses by strong and weak stimulation individually, (2) sum of the two traces shown in (1), (3) Response by paired stimuli, and (4) overlay of traces shown in (2) and (3)

