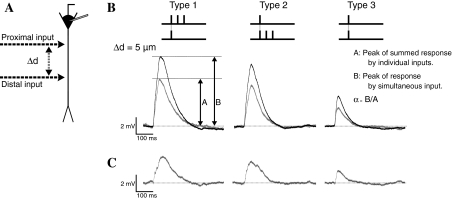
Fig. 2.
Nonlinear amplification by three stimulation sets. a Schematic diagram of stimulation sites. The distance between two stimulation sites is defined as Δd. b Examples of responses to the three stimulation sets at Δd = 5 μm. Black and gray lines indicate responses to paired stimuli and the sum of the responses to the two individual inputs, respectively. The peak of amplitude of the response to paired stimuli and sum of two responses are defined as (A) and (B) in the figure, respectively. The amplification rate (α) was defined as α = B/A. c The difference between the response to paired stimuli and the sum of individual responses

