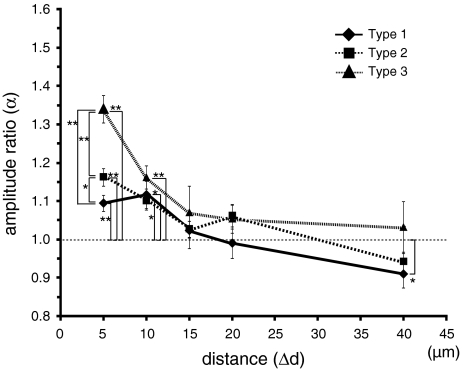
Fig. 3.
Distance dependency of amplification by paired stimuli. The Y-axis indicates the amplification (α), the X-axis indicates the distance between the two stimulation sites (Δd). The symbols in the graph indicate the type of stimulation: Type 1 (filled diamond); Type 2 (filled square); and Type 3 (filled triangle). Error bars indicate the standard error of the mean and asterisks indicate the level of significance: * P < 0.05 and ** P < 0.01

