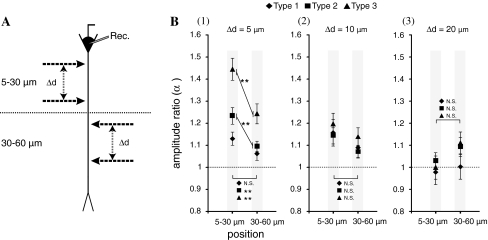
Fig. 4.
Dependency of amplification of the area of stimulation sites. a The dendritic area 5–30 μm away from the soma was defined as the proximal area, and the area 30–60 μm away was defined as the distal area. Paired stimuli were applied in both areas. b The graphs of area dependency for (1) Δd = 5 μm, (2) Δd = 10 μm, and (3) Δd = 20 μm. The Y-axis indicates the amplification ratio (α), and the X-axis indicates the stimulation area. The symbols in the graph indicate the type of stimulation: Type 1 (filled diamond), Type 2 (filled square), and Type 3 (filled triangle). The errors bar indicate standard errors of the mean and asterisks indicate the level of significance: ** P < 0.01

