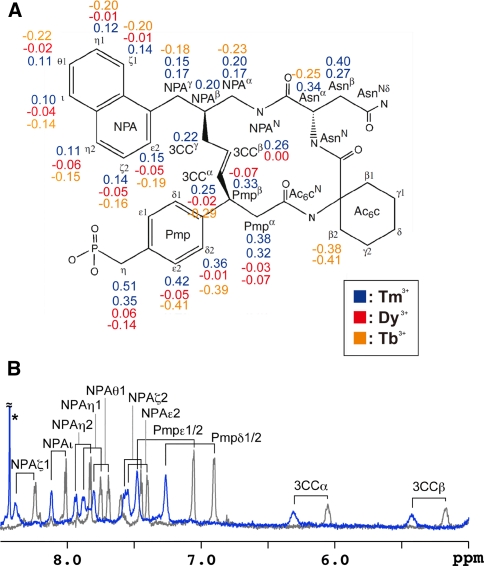
Fig. 7.
Analysis on the high-affinity inhibitor and LBT-Grb2. a The chemical structure of the inhibitor in which the protons were labeled. Proton signals were assigned according to the previous work (Ogura et al. 2008). Observed PCS values are indicated. b Overlay of the 1H 1D spectra of the high-affinity inhibitor complexed with 2H15N-labeled LBT-Grb2. The spectra measured in the presence and absence of the paramagnetic lanthanide ion Tm3+ are shown in blue and gray, respectively. An asterisk indicates an impurity. Spectra were acquired using an 800 MHz NMR spectrometer at 25°C

