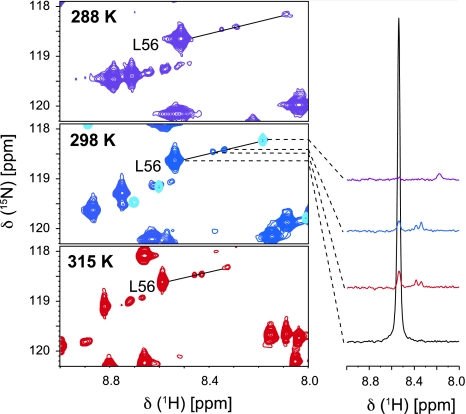
Fig. 4.
Sections of the 1H,15N HSQC spectra from Cys-Ph-TAHA tagged ubiquitin-T12C, loaded with thulium at different temperatures. The spectrum at 298 K is overlaid with the diamagnetic reference (light blue). The spectra are displayed at low contour level. For L56, the 1D-traces, all plotted at the same noise level, are shown representatively. The relative population of the minor peaks is not increasing within the temperature range of 278 to 315 K

