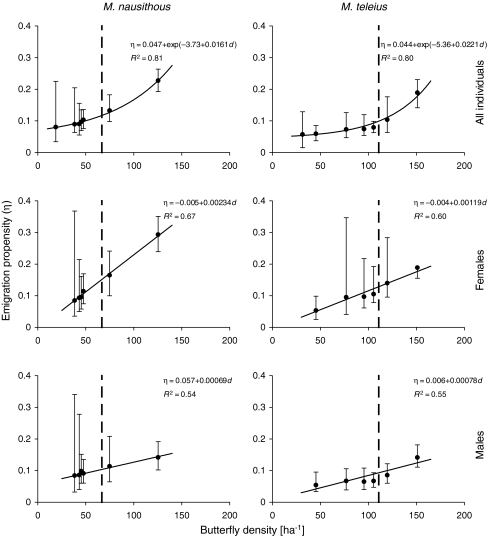
Fig. 3.
The virtual migration model estimates of emigration propensity (η; shown with 95% confidence intervals) in the investigated metapopulations of Maculinea butterflies presented against their densities (d) in a given year. Broken vertical lines indicate carrying capacities for both species. Solid lines represent best-fit regression lines based on simulations, in which the values of butterfly density and their emigration propensity were drawn 10,000 times according to the likelihood distributions of their estimates

