
Figure 1.
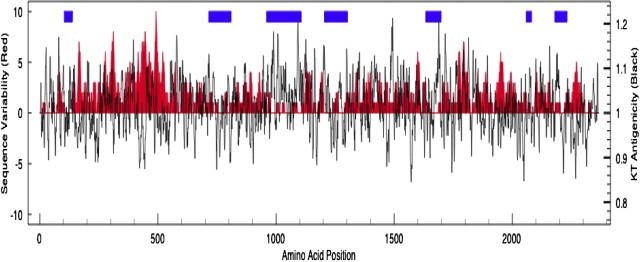
Amino acid heterogeneity (red) and predicted antigenicity of toxin B protein (black lines) based on an alignment of amino acid sequences of toxin B from 16 C. difficile isolates. The red-shaded plot is the variability of the amino acid sequences of toxin B at each amino acid position; great amino acid diversity is indicated by higher peaks. The black line indicates the predicted antigenicity of the protein based on the algorithm of Kolaskar and Tongaonkar (KT)52 (high peaks indicate high antigenicity). The blue bars indicate regions of DNA sequence conservation among the 16 isolates. The 16 isolates include strains of PCR ribotypes 001, 017, 027, and 078 and pulsed-field gel electrophoresis types NAP1, NAP7, and NAP8.