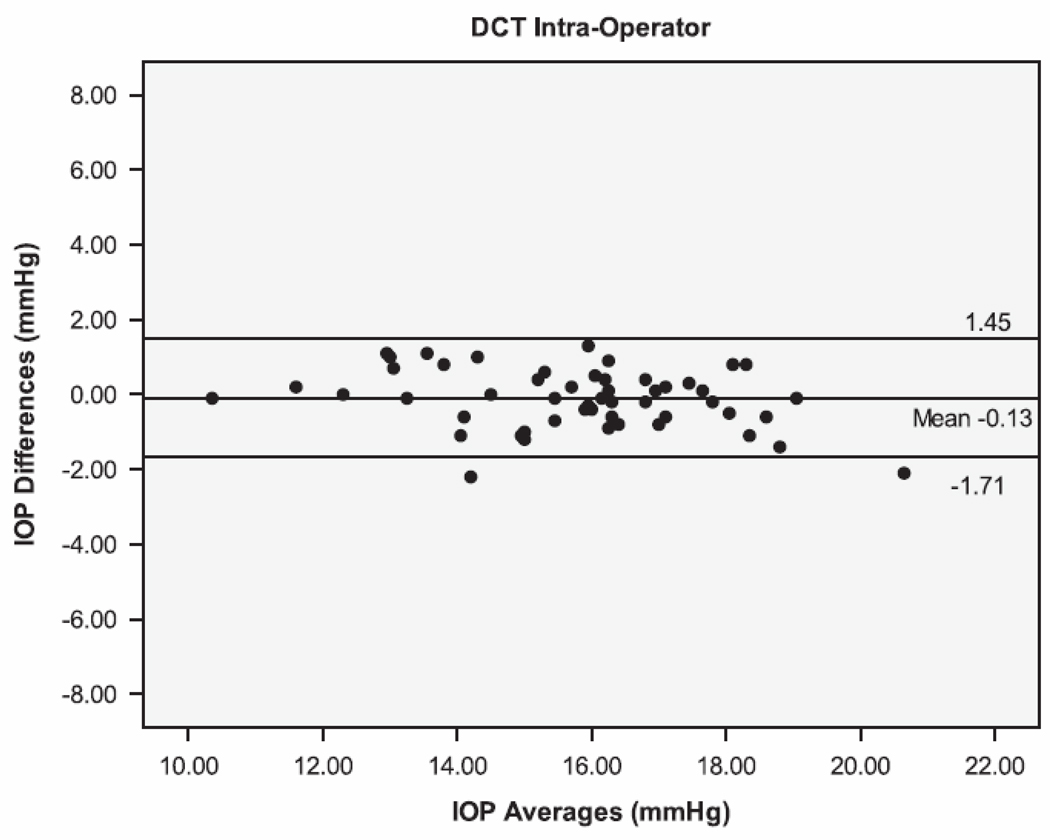
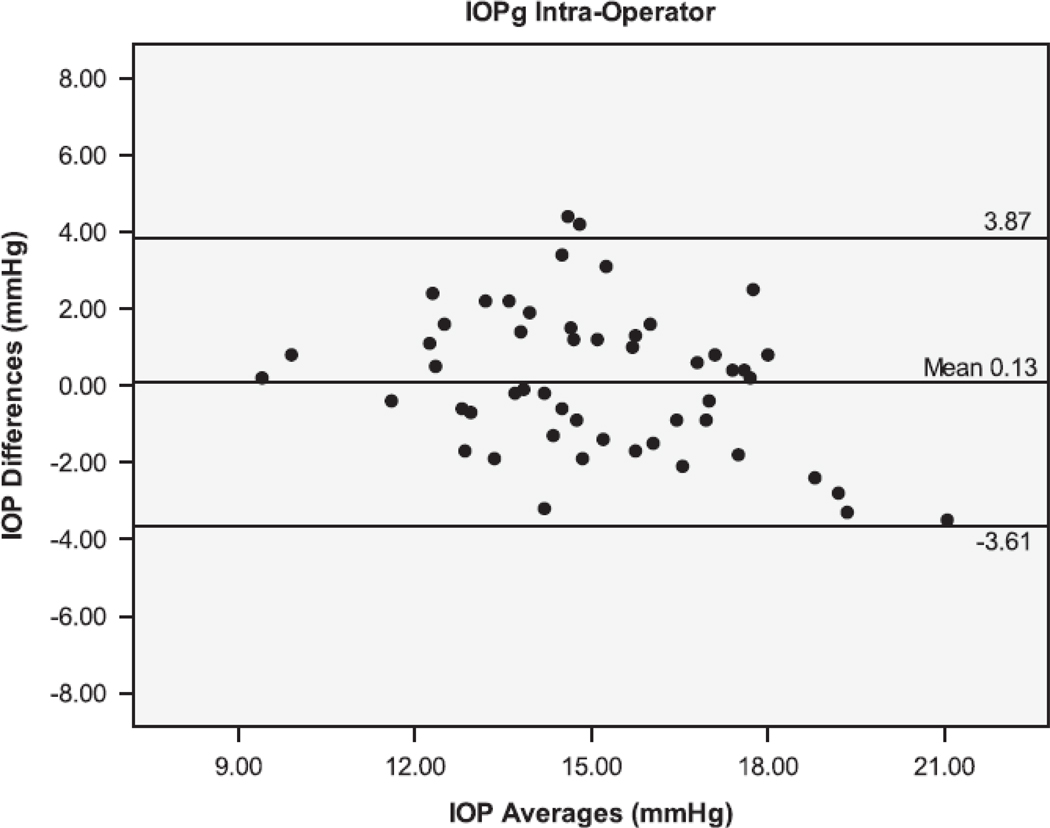
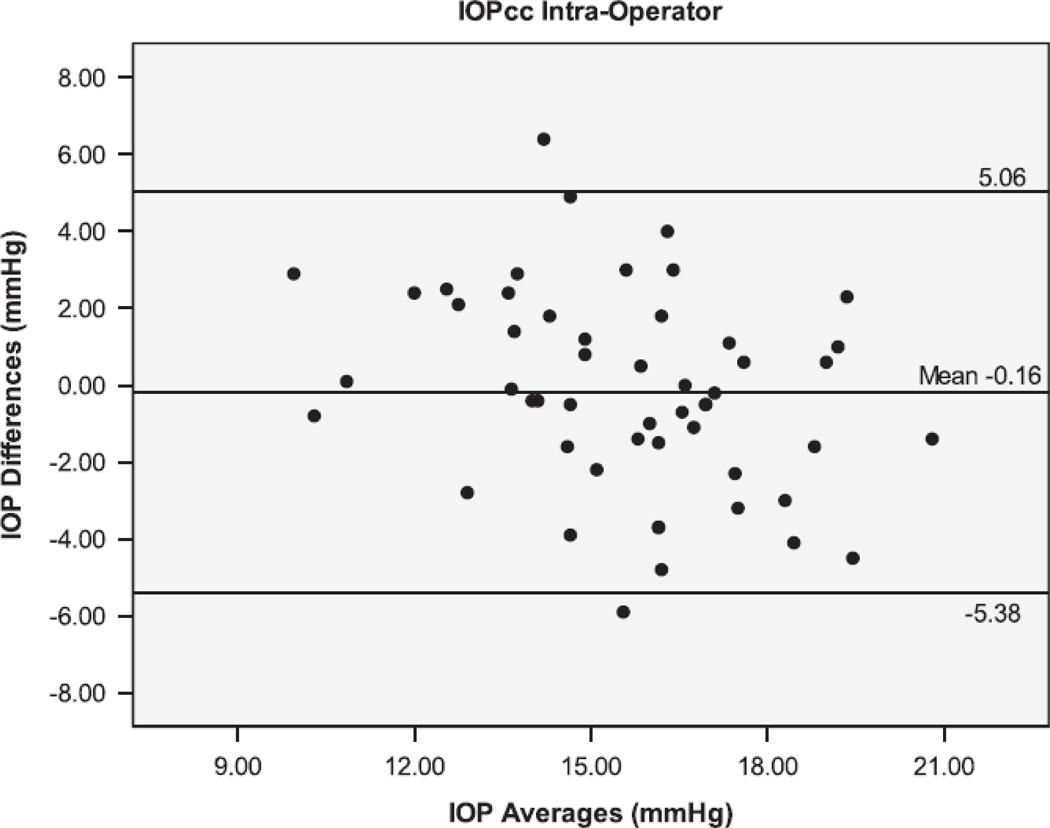
Figure 1.
Bland-Altman plots of the Intraocular Pressure (IOP) measurements by the Dynamic Contour Tonometer (DCT), Goldmann Applanation Tonometer (GAT), Ocular Response Analyzer - Goldman Estimated (IOPg) and the Ocular Response Analyzer – cornea corrected (IOPcc) for the Intra-Operator group of measurements.


