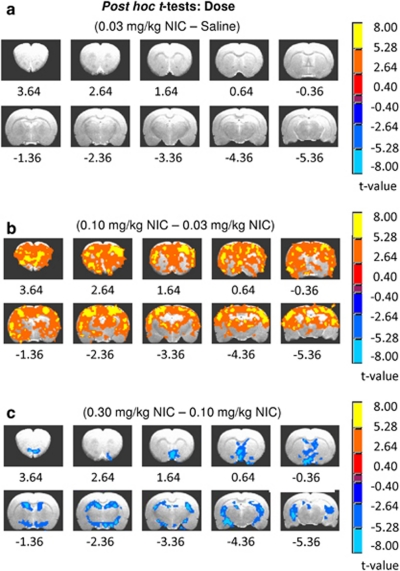
Figure 3.
Difference maps for the post hoc t-tests for the DOSE main effect showing the dose-dependent effects of nicotine (NIC) on relative cerebral blood volume (rCBV) peak amplitude. Voxels in each of these t-maps were thresholded for group comparisons at pcorrected <0.005. (a) The lowest dose of nicotine tested was without effect and thus was functionally equivalent to saline. (b) Effects of 0.10 mg/kg NIC compared with 0.03 mg/kg NIC were widespread and represent the apogee of the inverted U-shaped dose–effect curve. (c) The blue colors in this contrast map indicate decreases in activation between the high and middle NIC doses, suggesting a less efficacious action as dose increased, comprising the right (falling) side of an inverted U-shaped dose–response relationship.

