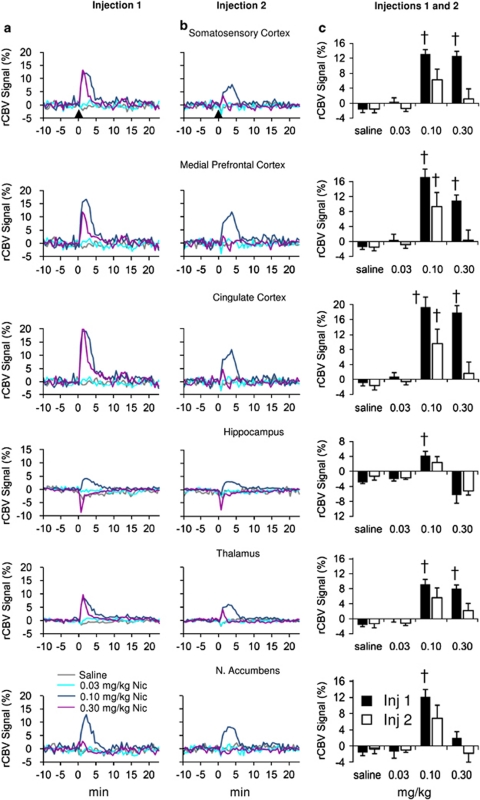
Figure 4.
Relative cerebral blood volume (rCBV) time courses and peak responses in selected brain regions demonstrating acute nicotine tolerance development as a function of DOSE and INJECTION. Injections were spaced 25 min apart. Signal intensity values, expressed as a percent change of the preinjection baseline for each group, were averaged across activated voxels in each region of interest (ROI) as identified by analysis of variance (ANOVA). Columns (a) and (b) show the time courses for the first and second injections, respectively. Column (c) bar graphs present the mean peak amplitudes±SEM of the respective fitted time courses for injections shown in columns (a) and (b). (†) Signifies a difference from the saline condition (p<0.05 after Bonferroni correction). All injections occurred at time 0, shown by black arrow in columns (a) and (b).

