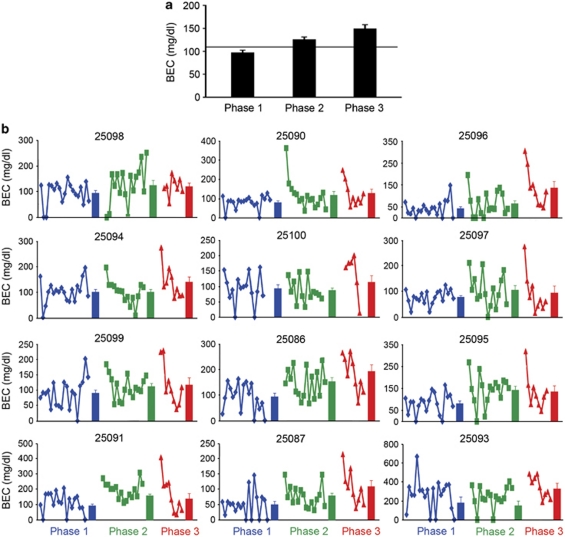
Figure 3.
Blood ethanol concentrations in the three pre-abstinent drinking phases. (a) The effect of repeated abstinence on mean (±SEM) BECs. The solid horizontal line indicates baseline BECs averaged over 8 months preceding phase 1. (b) The individual and average BEC (solid bars±SEM) measurements for individual monkeys during phase 1 (blue), phase 2 (green), and phase 3 (red) arranged from the lowest (top left) to the highest (bottom right) average daily drinkers.

