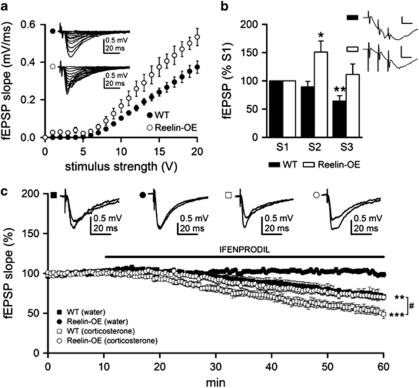
Figure 5.
Reelin overexpression modifies synaptic activation of NMDA receptors and the function of NR2B subunit. (a) fEPSP slopes for WT (filled circle, n=12 slices from three mice) and Reelin-OE (open circle, n=10 slices from three mice) slices for a given range of stimulus intensities. Note that Reelin-OE CA1 neurons tended to exhibit increased fEPSP responses. Inset shows representative fEPSPs recorded in the stratum radiatum, and evoked by stimulation of the Schaffer collateral-commissural pathway with different intensities in WT (top) and Reelin-OE (bottom) mice. (b) Summary data showing mean NMDA-isolated fEPSP slopes in WT (filled bar; n=7 slices from three mice) and Reelin-OE (open bar; n=6 slices from three mice) slices. The fEPSP slope was significantly smaller in the WT mice for the third stimulus and significantly larger in the Reelin-OE mice for the second stimulus (compared with its respective first stimulus). Significant differences were established at *p<0.05 and **p<0.01. Inset shows representative field responses of NMDA component evoked by a 100 Hz train (three stimuli) in WT (top trace) and Reelin-OE (bottom trace), recorded in the presence of 20 μM CNQX to block the AMPA component. Calibration: 0.5 mV, 10 ms. (c) Time course of 3 μM Ifenprodil effects on normalized mean NMDAR-mediated fEPSP slopes evoked by Schaeffer collateral stimulation in WT control (filled square, n=6 slices from three mice), WT treated with corticosterone (open square, n=6 slices from three mice), Reelin-OE control (filled circles, n=6 slices from three mice), and Reelin-OE treated with corticosterone (open circles, n=6 slices from three mice) slices. Inset shows representative fEPSPs recorded in the absence or presence of Ifenprodil. Significant differences were established at **p<0.01 and ***p<0.001 (with respect to pre-Ifenprodil perfusion baseline slope values) and #p<0.05 (between WT and Reelin-OE treated with corticosterone). Data are presented as mean±SEM.

