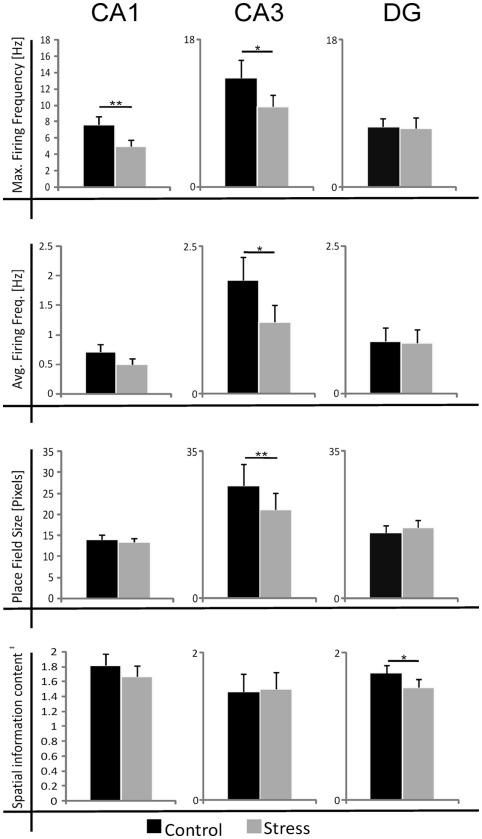
Figure 2.
Summary of the effects of acute photic stress on CA1, CA3, and DG cells; CA1 and CA3 cells generally experience a significant decrease in firing activity whereas spatial characteristics are mainly unchanged. In contrast, DG cells do not experience a change in firing rate after stress. Black bars represent mean sample values of control sessions and gray bars represent mean sample values of stress sessions. The size of place fields was defined by the firing frequency above 20% of the maximum firing frequency. In total 99 cell pairs (control/stress) were recorded. nCA1 = 34, nCA3 = 18, nDG = 47 *p < 0.05, **p < 0.01, ‡Spatial information content in bits per spike.

