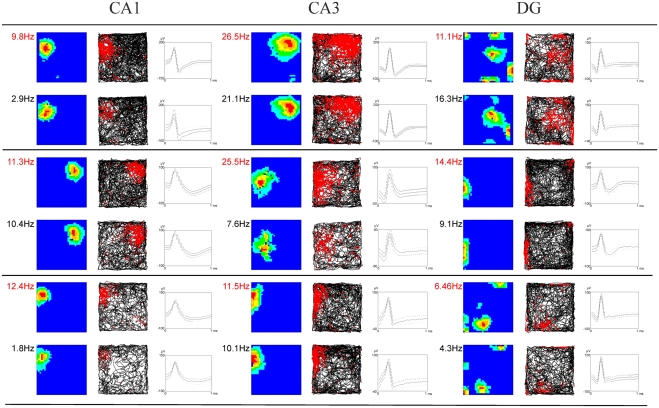
Figure 3.
Examples of firing characteristics of hippocampal and subicular neurons. The first column of each subregion depicts the smoothed color coded map showing the firing rate per pixel scaled to the maximum firing rate within the environment at the top left. Dark blue denotes the lowest firing category and red indicates the highest firing category. Color steps are in 20% of the maximum firing rate. The second column shows the corresponding path trajectories and the corresponding spikes of the neurons in red. The third column depicts the cell signal of the most prominent channel where time is plotted on the x-axis and spike amplitude is plotted on the y-axis. Two consecutive rows always show the same cell in both the control (firing rate in red) and stress condition (black).

