
Figure 4.
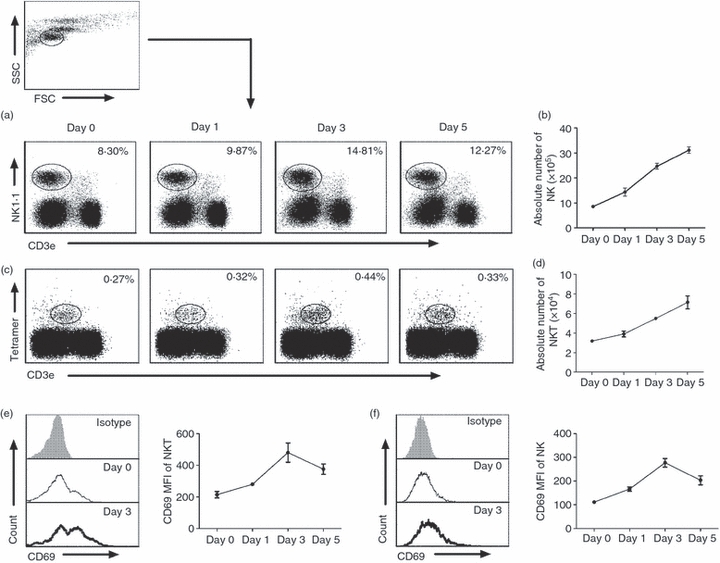
Natural killer (NK) and NKT cells expand and become activated following Chlamydia muridorum lung infection. Mice were infected with C. muridorum elementary bodies (2 × 10³IFUs) intranasally and killed at various days after infection. Lung mononuclear cells were prepared as described in the Materials and methods and stained for PBS-57 glycolipid-loaded CD1d tetramer, NK1.1, CD3e and CD69. Representative dot plot of the percentage of NK (NK1.1+ CD3e−) cells (a) and iNKT (PBS-57 glycolipid loaded CD1d tetramer+ CD3e+) cells (c) among gated lymphocytes based on forward and side scatter (as shown in Fig. 1) are shown. Kinetics of the absolute number of NK cells (b) and iNKT cells (d) in lung after infection. The data represent one of four independent experiments and are shown as mean ± SD for three mice. (e) Left panel: representative histograph of CD69 expression by iNKT cells (PBS-57 glycolipid loaded CD1d tetramer+ CD3e+) at day 3 after infection: isotype control antibody staining (grey histograms), uninfected mice (solid thin lines), infected mice (solid thick line). Right panel: the mean fluorescence intensity (MFI) of CD69 expression by lung iNKT cells. Data are mean ± SD of three mice. Three independent experiments were carried out. (f) Left panel: representative histograph of CD69 on NK cells gated as NK1.1+ CD3e− at day 3 after infection: isotype control antibody staining (grey histograms), uninfected mice (solid thin lines), infected mice (solid thick line). Right panel: the MFI of CD69 by lung NK cells. The data represent one of three independent experiments and are shown at mean ± SD for three mice.