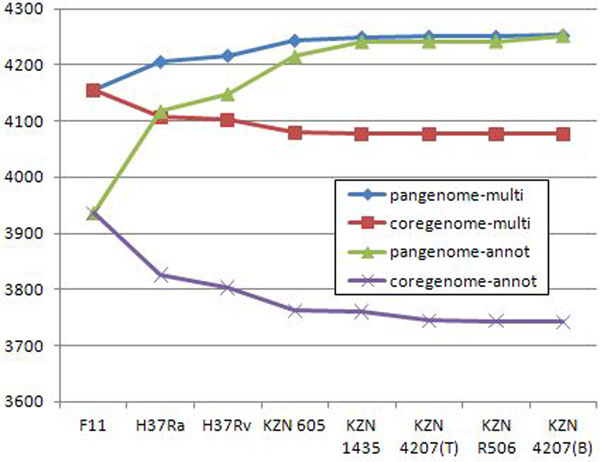
Figure 13.
M. tuberculosis, core genome vs pangenome Core vs. pangenome plots of 9 M. tuberculosis strains calculated using original annotations and multigene annotations, predicted by CAMBer. Strains are sorted (from left to right) in descending order of their genome sizes. Violet and green (coregenome-annot and pangenome-annot) lines connect cumulative numbers of core and pangenome sizes using annotated genes, while red and blue (coregenome-multi and pangenome-multi) lines connect cumulative numbers of core and pangenome sizes using multigenes after the closure procedure. The strain KZN V2475 was excluded due to wrong annotation, caused by a shift in gene coordinates. The proportion of core genome to pangenome size has risen from 88.5% to 96.1% after the closure.

