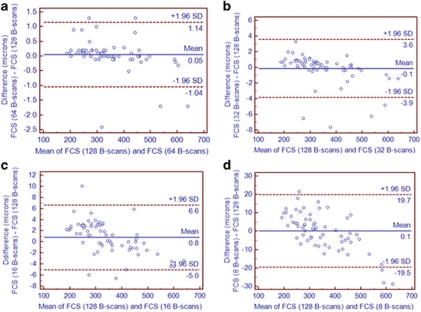
Figure 3.
Bland–Altman plots demonstrating the level of agreement between the ground truth and each reduced sampling density for the foveal central subfield retinal thickness. Central solid line indicates the mean absolute difference and dotted lines indicate the 95% confidence interval limits (upper and lower). (a) At a B-scan-sampling density that includes every other B-scan (64 B-scans with an equal spacing of 94 μm). (b) At a B-scan-sampling density that includes every fourth B-scan (32 B-scans with an equal spacing of 188 μm). (c) At a B-scan-sampling density that includes every eighth B-scan (16 B-scans with an equal spacing of 376 μm). (d) At a B-scan-sampling density that includes every sixteenth B-scan (eight B-scans with an equal spacing of 752 μm).

