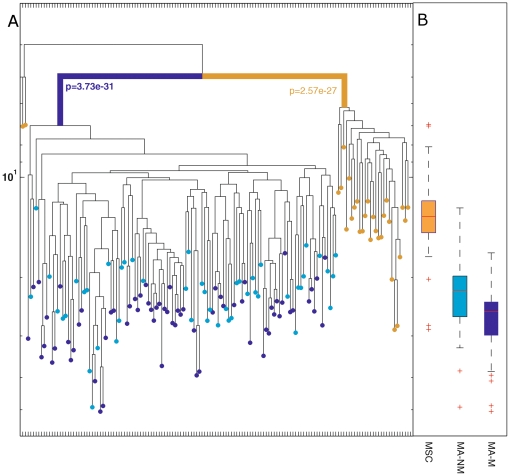
Figure 3.
(A) Lineage tree of 116 myofiber-associated cells (68 myogenic in blue, and 48 non-myogenic in light blue), and 29 MSC (brown) from a 330 day old mouse. Each terminal node (•) represents the ancestor of a single sampled clone. The vertical axis represents cell depth. Blue and brown lines indicate significant clustering of cells. The clustering of myofiber-associated cells is significantly different than that of MSCs (p<1e-26); (B) Boxplot of the depth of myofiber-associated and MCS cells extracted from a 330 days old mouse. The box represents the spread of the middle 50% data regarding the depth of all tested clones and the red lines represent the median value of depth. Whiskers at the ends of vertical lines indicate the minimum and maximum depth values. The range in the 25th to 75th percentiles of all data was 11.8–14.6 for MSCs, 19.9–26.2 and 23.7–29.7 for myofiber-associated, non-myogenic and myogenic cells, respectively.

