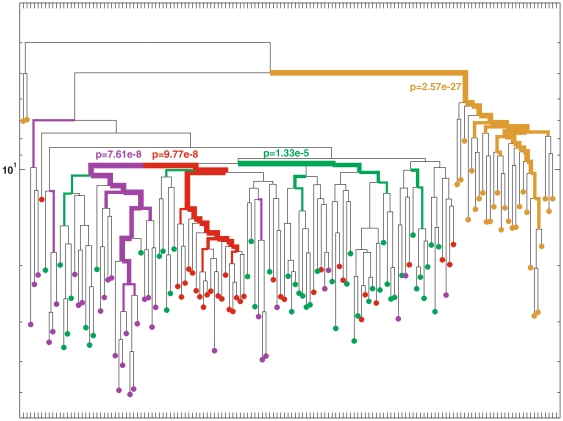
Figure 4. Clustering of MSCs and myofiber-associated progenitors from a 330 day old mouse.
Cells from the left Gast muscle are depicted in green and from the and right Gast in red; cells from the right Masseter are depicted in purple. MSCs are depicted in brown. Myofiber-associated cells were significantly clustered according to the muscle they were extracted from with the p-values denoted in the figure.

