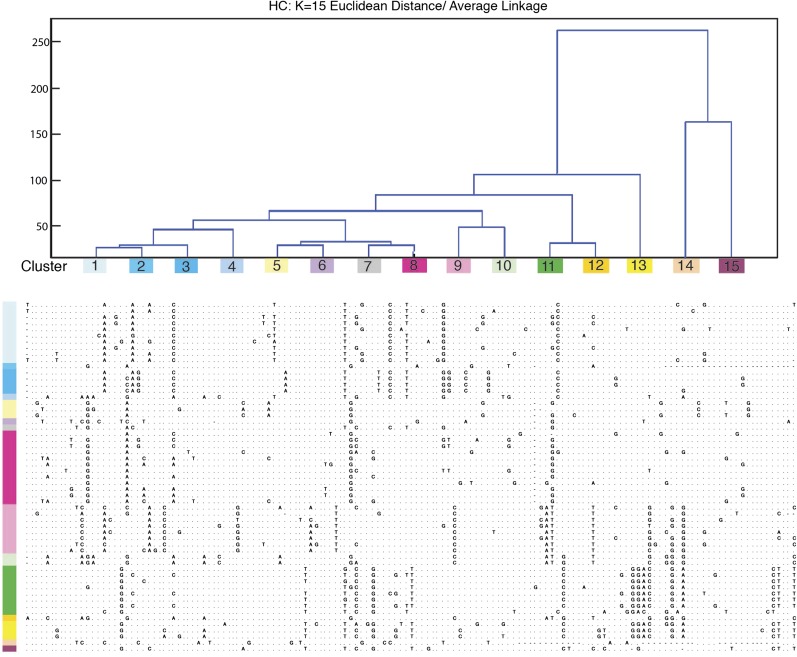
FIG. 4.—
Clusters of DMA1 monomers by hierarchical clustering method (k = 15). DMA1 was defined by systematically cutting the hierarchical trees resulting in monomer classifications. Color-corded clusters show base positions in each monomer, which differ from one another. Optimal cluster number (k = 15) was determined after evaluating the highest average measure of cluster proximity (where k = 1–20) and concurrently evaluating dendrogram topology provided by hierarchical clustering. For individual monomers, sequences corresponding to the consensus base (fig. 2A) are indicated by dots while sequences differing from the consensus base are given. Gaps introduced to optimize alignment are indicated by dashes.

