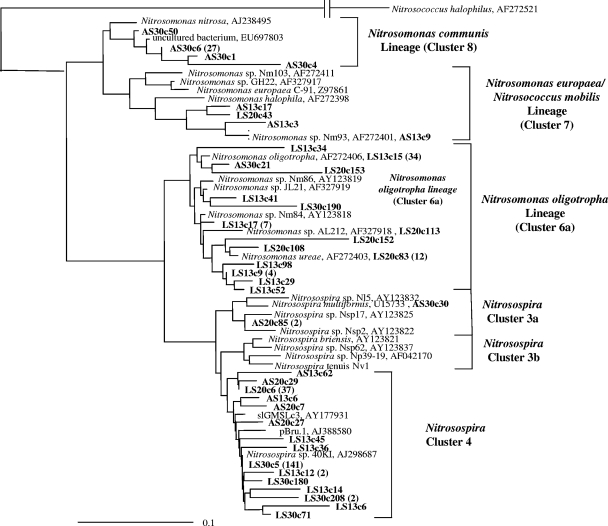
Fig. 2.
Fitch-Margoliash phylogenetic reconstruction (with global rearrangement and randomized input order; seven “jumbles”) of the relationship between AOB and the closest relatives retrieved from GenBank, based on partial bacterial AmoA sequences (150 amino acids) retrieved from the heavy fraction of the six treatments incubated for 6 weeks. Leutra South (100 μM NH4Cl) and Ammerbach biofilm enrichments (1,000 μM NH4Cl) are denoted as LS and AS, respectively. The clone designations give the biofilm enrichment and temperature of incubation followed by a random clone number; e.g., AS13c20 indicates a clone from the Ammerbach biofilm enrichment incubated at 13°C. The number of clones from each treatment and their phylogenetic affiliations are described in Table 4. Clones obtained from this experiment are highlighted in bold. The values in parentheses represent the total number of AmoA sequences with identities of >99% based on their amino acid sequences, with the group represented by a single clone sequence. GenBank accession numbers are shown. The scale bar indicates 10 changes per 100 nucleotide positions.

