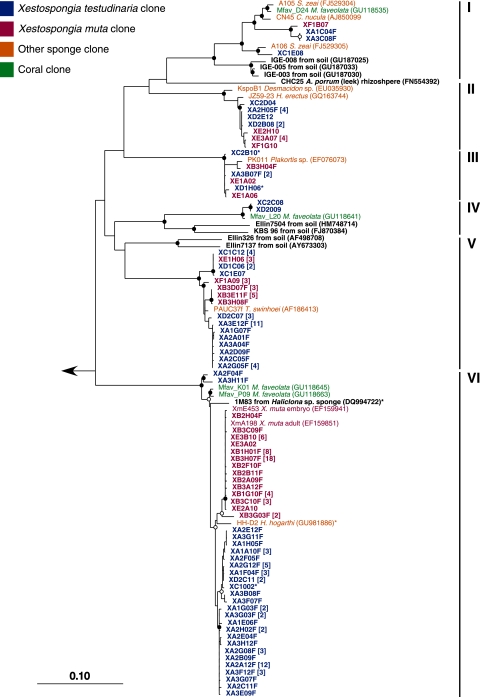
Fig. 7.
Neighbor-joining tree of the Acidobacteria 16S rRNA gene sequences from X. muta and X. testudinaria and their CRs. Sequences from this study are in bold red (X. muta) and bold blue (X. testudinaria). The closest cultured representatives are in bold black. Short sequences added by parsimony are indicated by an asterisk. Bootstrap values (neighbor-joining method, 100 replicates) are indicated by closed circles (values of >90%) and open circles (values of >75%). The arrow goes to an outgroup of bacterial 16S rRNA gene sequences representing the other phyla observed in this study. The scale bar represents 10% sequence divergence.

