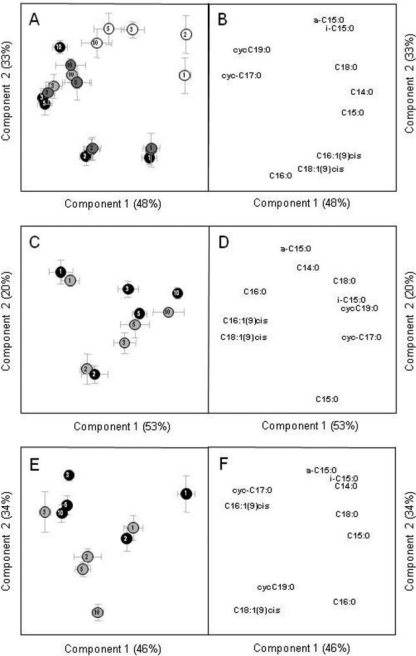
Fig. 6.
Scores and loadings of the 2 main components of the PCA performed on the FAME composition (A and B) and the distributions of 2,4-D ring-C (C and D) or 2,4-D chain-C (E and F) in FAME, representing 91%, 73%, and 80% of the variability, respectively. Variables were the relative abundance of C. necator JMP134 FAME from day 0 to day 10 of the incubation. The black, white, and gray circles represent incubation with 2,4-D, glucose, or mixtures of 2,4-D and glucose, respectively. The numbers in the circles represent the dates of sampling. Standard deviations were derived from three experimental replicates.

