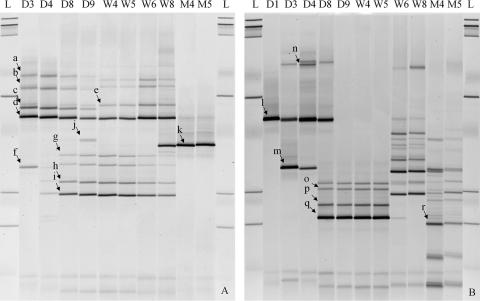
Fig. 3.
Predominant ART bacteria during infant (baby Q) development, assessed by DGGE analysis. (A) Tetr bacteria on CBA plates. (B) Ermr bacteria on CBA plates. Data are presented in a time-lapse manner (D, day; W, week; M, month). L, DNA ladder. a to e, Staphylococcus sp.; f, Streptococcus sp.; g to i, Veillonella sp.; j, Peptoniphilus sp.; k, Enterococcus sp.; l and n, Staphylococcus sp.; m, Streptococcus sp.; o to q, Klebsiella sp.; r, Enterobacteriaceae.

